How to show logs in browser console
I know, I know, how difficult can be show logs in browser, you can use console.log(), it's a simple line of code that you can include in any part of your JavaScript application with a parameter and will work, it will show the information you want in the console right? but in this post I want to show you how to log in different ways that you maybe don't know.
I will start with the most common, as you know is console.log(), and 99% of the time will do the job that you need, for this simple method I want to share my personal way of use.
To execute the examples please first open your console with Ctrl + Shift + J (on Windows) or Ctrl + Option + J (on Mac)
Did you noticed the difference? in the first logs you lack of context, you can see the values in the console but you don't know which value belongs to each variable, my recommendation is to wrap the variables with { }, that will create an object with the variables, letting you know the variable name and it's value.
Also there are other kind of logs like console.info(), console.warn(), console.error(), console.debug() and console.trace(), each one has different level on the browser log, working in almost the same way.
As you can see console.info(), console.warn(), console.error() and console.debug() level show the fist parameter like console.log(), with the difference that console.warn() and console.error() also show the stack trace, similar like console.trace(). By default debug level does not appear in the console, you have to select Verbose level in the drop down next to filter in the top menu.
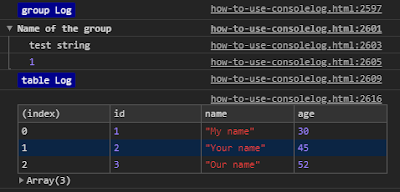
Now let's step into a better formatting of logs, there are two methods that I want to cover on this, first one is console.group(), this method allow us to group the logs, that will help us to expand or contract the log information. Second one is console.table(), this method allow us to show the information in table format providing an array of objects to this one, an example of both is down here.
As simple as that, now you know how to present the information in different ways in the console, if you require more information about console API or it's use, yo can take a look on the documentation:
https://developers.google.com/web/tools/chrome-devtools/console/api
https://developer.mozilla.org/en-US/docs/Web/API/console


Comments
Post a Comment